What Naapi does
Naapi (नापी) measures land on the map you already have. Open a Bihar cadastral sheet — a mauza naksha from the Bhulekh portal, a scanned copy, or a photograph of the paper sheet — find the khesra (plot) you want, and read its area in decimal, katha and dhur. The plot's sides, corner angles and two independent area checks are shown with it, so a surveyor, a buyer or a family dividing land can see how the figure was reached and check it by hand.
The same window divides a plot (batwara) equally, by ratio, by a fixed area or along a line you draw; lays a second sheet over the first and matches them corner to corner; puts the sheet over a satellite picture; walks a boundary with the phone's GPS; and prints a report with every figure on it.
Everything runs in the browser, on the device in your hand. The map file never leaves it. Nothing is sent anywhere unless you ask for it — a sheet from the shared library, the Google satellite map, or a place search.
A measurement taken from a scanned map is an estimate of what the map shows. It is a working aid for the surveyor and the parties; it is not itself a legal record. See Accuracy and legal standing.
Get your map
Naapi works on any picture of a cadastral sheet:
- A PDF from the Bihar portals. The Revenue and Land Reforms Department publishes the scanned CS, RS and Chakbandi sheets of most mauzas as PDF files. How to find and download yours is on the Bihar portals page. These PDFs are the best input: most of them carry the map as drawn lines, and Naapi reads those lines directly, so a plot's outline comes out exact.
- The shared library. Sheets that have already been loaded into Naapi's library open with one tap — no download, no file to manage. The library page lists which mauzas are there. It is open to signed-in users, or to everyone once the owner has switched it on.
- A scan or a photograph. Any JPG or PNG works. For a paper sheet, use the 📷 Photograph a map button on a phone: hold the phone flat above the sheet, in even light, with the whole sheet in the frame. A photographed sheet needs the scale set by calibration, since the picture has no fixed scale of its own.
- A satellite picture, saved from Google Earth Pro or taken from the Google map inside Naapi — see Satellite and GPS.
Open a map
The left panel is a checklist: 1 Map, 2 Find plot, 3 Map scale.
- Under 1 Map, press Choose map PDF or image, or drop the file onto the box. PDF, JPG and PNG are accepted, up to 40 MB. A multi-page PDF opens on its first page; the ◀ ▶ buttons above the map turn pages.
- Wait for Map ready. A portal PDF takes a second or two; the sheet's drawn lines are read at the same time, so plots can be picked straight away.
- To open a sheet from the shared library instead, open the 📚 Map library fold: choose district, anchal and mauza, then tap the sheet. Or type a mauza name or thana number in its search box.
To put the current map away and begin with an empty window, press the ✕ beside the loaded file's name (Start fresh). The project you were on stays in Recent projects at the bottom of the panel, with its plots, and reopens from there.
Find the plot
There are three ways to get a plot outline, from least to most effort.
By khesra number
Under 2 Find plot, type the number and press Find plot. Several numbers can be typed at once, separated by commas or spaces (994, 995, 1000); Devanagari digits are fine. Naapi finds the number in the PDF's text, follows the closed boundary around it and draws the plot. This needs a PDF with a text layer, which the portal's PDFs have; on a scan, press Read plot numbers (OCR) first and the numbers are read from the picture (the OCR engine downloads once, about 8 MB, and then works offline).
Auto-detect
Choose Auto-detect in the tool strip and click inside any closed plot. On a portal PDF the outline is taken from the map's own drawn lines, corner for corner, so neighbouring plots tile exactly. On a scan or photograph the boundary is traced through the pixels instead; the status line says which route was used and flags anything doubtful (a wall drawn open and closed for you, a line that stops short).
Draw it yourself
Choose Draw and click the corners in order. The cursor snaps to the map's lines (the Snap choice under the map picks the line's centre, its inside edge or its outside edge). Double-click, or press Enter, to close the plot; Esc cancels. Draw is also how you outline a plot on a photograph, or a piece of land that is not a numbered khesra.
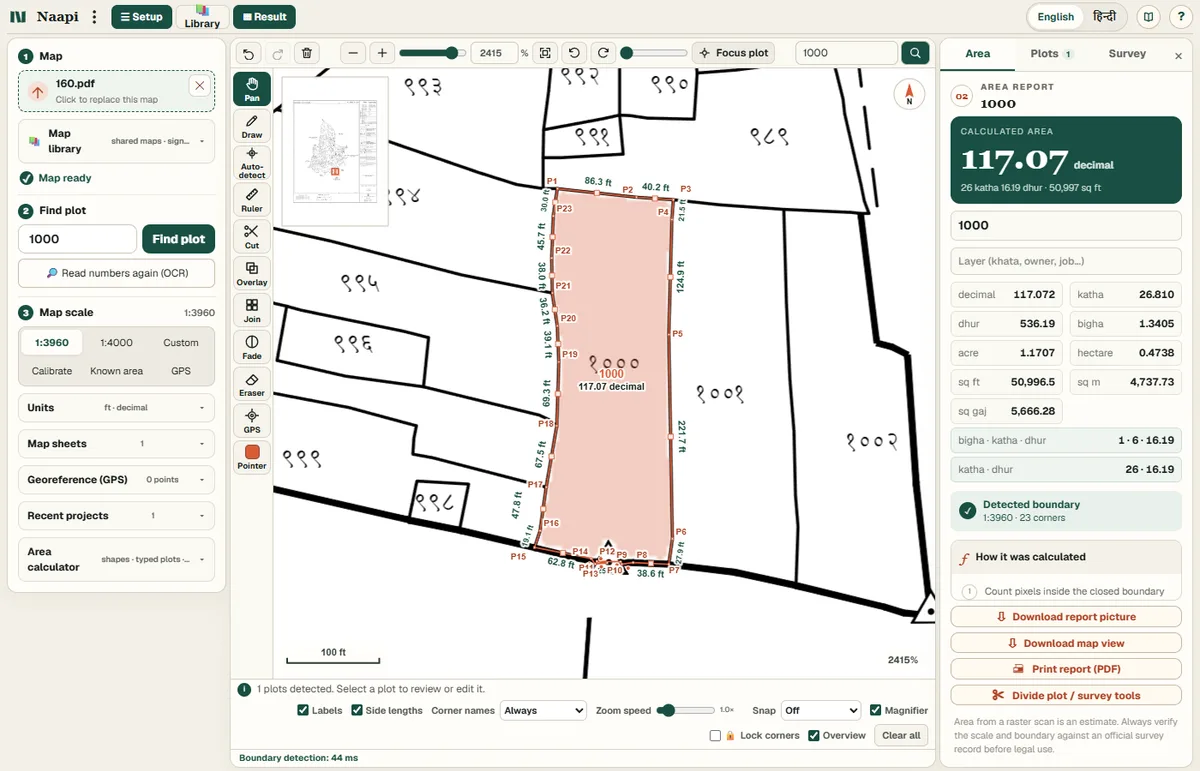
A found plot appears in the Plots tab on the right with a colour and a name; several plots can be kept and their total is shown.
Set the scale
A map is only a picture until its scale is known. Under 3 Map scale:
- 1:3960 is the Bihar default — the old 16 inches to the mile — and 1:4000 is the other common sheet scale. For a portal PDF one of these is right; check the legend on the sheet, which usually states the scale.
- Custom takes any ratio, or 1 inch = N ft.
- Calibrate is for photographs, screenshots and any sheet whose scale is unknown: press it, click the two ends of something whose length you know (the scale bar printed on the sheet, or a boundary you have measured on the ground), type that length, and save.
- Known area derives the scale from a plot whose recorded rakba you trust: select the plot, type its area from the khatiyan, and every other plot on the sheet is then measured at that scale. It is also a good check of a preset.
- GPS uses two or more georeferenced points (see Satellite and GPS); on the Google satellite map the scale is set by the map itself.
For a scanned image Naapi also asks the scan's DPI, because a scan's pixel size depends on it.
Read the area
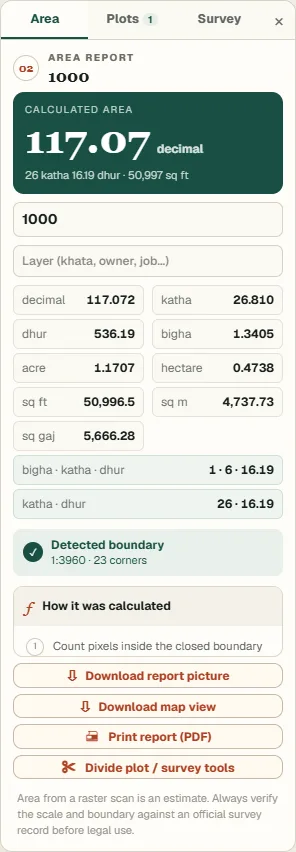
The Area tab on the right shows the selected plot's area in large type — decimal by default — with katha · dhur and square feet beneath it, then a full table in every unit (bigha, katha, dhur, decimal, acre, hectare, square metres, feet and gaj). The line under the figure says how the outline was made (Detected boundary or Traced polygon), the scale used and the number of corners.
How it was calculated is written out in three steps: the polygon's area in the map's own pixels by the shoelace formula, the scale applied (metres per pixel, squared), and the conversion to decimal (÷ 40.468564 square metres). The Survey tab adds two independent checks of the same polygon — by triangles, and by the kanghi (parallel ordinate) method the amin uses — and the three figures are shown side by side. They agree with each other to the last digit when the arithmetic is right; they cannot tell you whether the outline itself is right, which is why the sheet and the ground still have the last word.
Edit the drawing and read the labels
Every corner can be moved: drag it, and a magnifier appears so you can place it on the line. Drag the small square in the middle of a side to add a corner there. Right-click a corner (or select it and press Delete) to remove it; the arrow keys nudge the selected corner a pixel at a time, ten with Shift. Every change can be undone with Ctrl+Z and redone with Ctrl+Y, without limit.
Around the plot Naapi writes the length of each side, along the side and outside the plot. When a side is too short for its figure, the text shrinks, then runs a little past the side, and finally becomes a small dot: the length of a dotted side is in the Survey table (side n starts at corner Pn). Figures are never dropped and never drawn across a line. When the map is zoomed far out, so that the plot is small on the screen, the figures are hidden altogether rather than piled up. The corner names P1, P2 … disappear two seconds after you last touched the map and come back on any movement; the Corner names choice under the map makes them dim instead, or keeps them always.
Under the map: Labels and Side lengths switches, Snap, the Magnifier, and two locks — Lock corners so a plot cannot be nudged by accident while you pan, and Lock lines for division lines. Overview shows a small map of the whole sheet with your position on it.
Divide a plot (batwara)
Select a closed plot and open the Survey tab (or press Divide plot / survey tools under the area). Under Divide plot (batwara) choose a method:
- Equal parts — into 2, 3, 4 … pieces of equal area.
- By ratio — for example
2:3, or1:1:2for three shares. - Take a fixed area — cut off exactly so many decimal, katha or square feet, the rest stays.
- Cut along a line I draw — click points across the plot; the cut can be straight, bent at each click, or Curved.
- Draw a piece as a shape — draw the piece's outline inside the plot.
- Manual: drag lines on the map — place division lines by hand and read the live area of each piece as you move them.
For the computed methods, say where the cut starts from (the left, right, top or bottom of the map), or make it parallel to a chosen side, or give it an angle. Press Preview division to see the pieces with their areas; drag a line's ends to adjust it. Concave plots work. Make pieces into plots turns the pieces into named plots of their own, which can be measured, exported and printed like any other. Two plots can be merged, and Check overlap shows where two outlines cover the same ground.
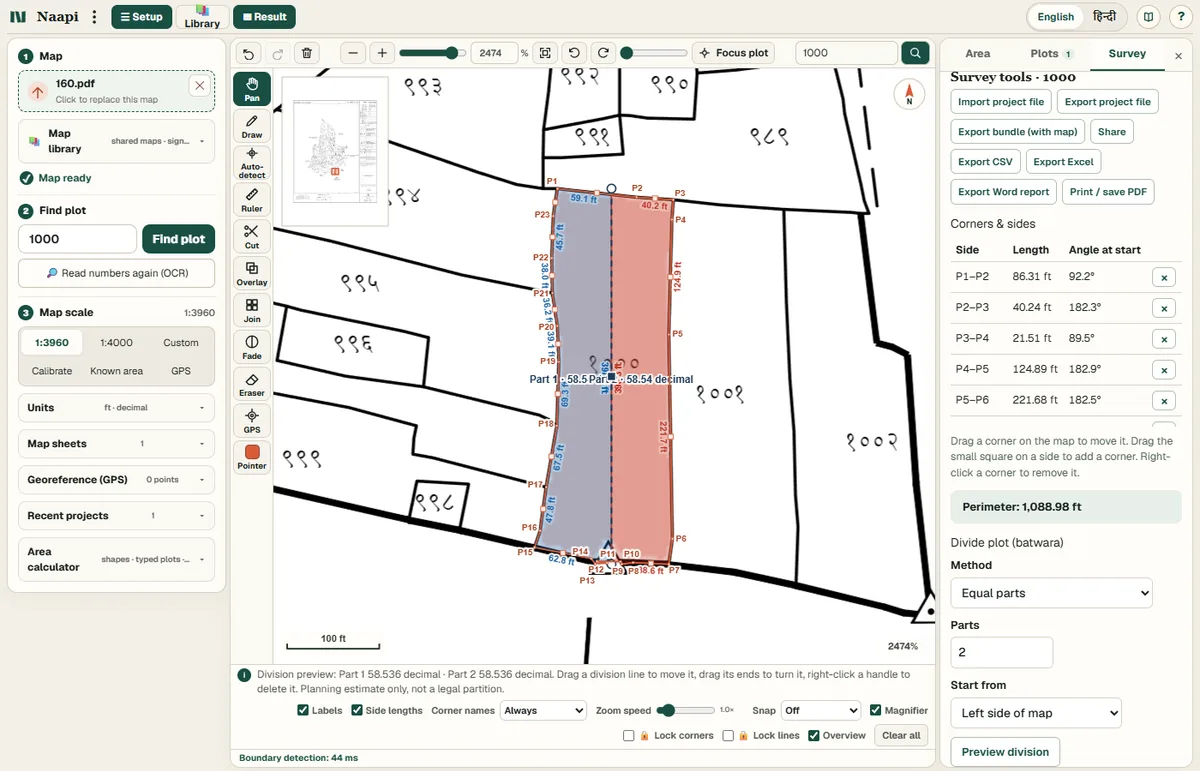
Batwara cuts are straight lines; existing corners stay fixed. The result is a planning estimate to talk over — not a legal partition, which is made on the ground by the competent authority.
Several sheets: overlay and join
A mauza rarely fits one sheet, and an old CS sheet is often compared with the newer RS one.
- Overlay lays a second sheet on top of the first; Join puts it beside the first. Both then ask you to Match 2 points: click a corner on the base map, then the same corner on the new sheet; then a second corner, far away from the first, on each. The sheet snaps into place. If both sheets have a known scale the new one arrives at the right size, and matching only fixes its position and turn.
- In the Map sheets fold each sheet has its opacity, a blend (paper as scanned, multiply to see both, ink lines to keep only its lines, drawn in a bright colour over any imagery), a lock, Move sheet and Match 2 points again.
- Fade quietens the printed names and labels on any layer so your own drawing stands out (plot numbers always stay). The Eraser hides a box of printed text you do not want on the report — on scans too — and the boxes are saved with the project.
- Plots can be found and drawn on any sheet, and a plot's area is read through the scale of the sheet it is on.
Satellite and GPS
The Google satellite map
When the owner has set a Google Maps key (Admin), the 🛰 Satellite button under 1 Map opens Google's satellite map inside the measurement window itself, for signed-in users or for everyone once the owner opens it. Search for a place, pan and zoom, then draw, measure and divide on the imagery exactly as on a sheet, and press Overlay to lay a cadastral sheet over it — the sheet arrives at the map's scale and Match 2 points aligns it. The map's scale is set by the map itself. Fade imagery and Place names live in the Fade panel.
A saved satellite picture
Without the Google map, any satellite picture works as the base: save one from Google Earth Pro (press U then N for a flat, north-up view; File → Save → Save Image at maximum resolution, keeping the scale bar), or take a screenshot of Google Maps with the scale bar visible. Open it through the same Satellite button and say how big it is, in one of three ways: click the two ends of its scale bar and type the bar's length; click two places whose latitude and longitude you know; or type the width of ground the picture spans.
GPS points and the GPS walk
The Georeference (GPS) fold ties a sheet to real coordinates. Press Mark a GPS point, click a place on the map whose position you know — a well, a culvert, a boundary pillar — and type its latitude and longitude, or stand on it and press Use device GPS. With two or more points the fit is shown (metres per pixel, the direction of north, the ratio, the residual error at each point), Use GPS scale takes the scale from it, plots get latitude and longitude, and everything can be exported as KML or GeoJSON for Google Earth. The 🛰 and 🗺 buttons in the same fold put free satellite or OpenStreetMap tiles under the sheet for a visual check.
GPS walk measures a boundary on the ground: press Start, stand on each corner and press Mark corner, and the area is computed from the positions. With a georeferenced map the walked boundary can be added as a plot.
Satellite imagery is typically a few metres out of position and is not corrected for terrain. Use it to find a plot and to cross-check, not as the record; the amin's ground measurement is the record.
Without a map: the calculator
The Area calculator fold at the bottom of the left panel builds a plot from the lengths in a field book: a quadrilateral from four sides and the NW–SE diagonal (exact, by two triangles), the amin's average method (approximate unless the plot is a rectangle), triangles by three sides, two legs or base and height, square, rectangle, trapezium, and any polygon of 5 to 16 sides with its diagonals from the first corner. The shape is previewed as you type; where four sides and a diagonal allow two shapes, the hollow corner can be tapped to flip it, and a second diagonal decides it.
Draw as a plot puts the shape on a blank sheet at a round scale, where it can be divided, checked and printed like a plot from a map. Add to this map places it at the centre of the loaded map, at that map's scale, to lay a chain survey over the mapped plot. The Unit converter tab converts any area to all units.
Units
Lengths are shown in feet and areas in decimal by default. The Units fold changes the length unit (metre, feet, inch, gaj, kadi, link, zarib, lattha, km), the unit written on the map labels, and — because the katha is not the same size everywhere in Bihar — the local values: square feet to the katha, dhur to the katha, katha to the bigha, and the length of a lattha. Presets are provided (4.58 dhur to the decimal, 1 katha = 1902.18 sq ft, is the default; 6.4 dhur to the decimal; 720 sq ft) and every number is editable. The decimal, acre and hectare are fixed units and do not change. The Units page explains the units and has a converter.
Save, export, print, share
Work is saved automatically in the browser with the map file, and the last project reopens when you come back; Recent projects lists the others. From the Survey tab's toolbar:
- Export project file (JSON) keeps the plots, scale and notes; Export bundle adds the map itself, so a project can be moved to another device or sent to a colleague, who opens it with Import project file. Share uses the phone's share sheet.
- Export CSV — every side, length and angle, with each plot's area; Export Excel — a workbook with a summary, the sides, and both geometry checks; Export Word report — the map picture, the tables and the disclaimer, ready to print.
- Print / save PDF opens the print report: the map, an all-plots table with a total, each plot's corners and sides, both geometry checks, the batwara pieces and the project notes.
- Download report picture and Download map view in the Area tab give a PNG.
- KML and GeoJSON come from the GPS fold once the map is georeferenced.
The report scope (Selected plot, All plots, or chosen ones) is set at the top of the Survey tab.
Phone, install, offline, privacy
On a phone the window becomes three panes — Setup, Map, Result — switched from the bar at the bottom; the tool strip stays beside the map. The ⋮ menu holds Install app, Library, Calculator, Satellite, Start fresh, Sign in, Help, this Manual and the language. Tools are sized for a thumb; two fingers pinch to zoom and the magnifier appears while a corner is dragged.
Install app puts Naapi on the home screen, and after the first visit it opens without a network: the map tools, the calculator, saved projects and the printed report all work offline. The OCR engine for scans downloads the first time a map is opened and is kept. Only the shared library, the Google map and place search need a connection.
Privacy. Your map file and your plots stay in the browser's storage on your device; nothing is uploaded. A sheet you open from the library is downloaded to your device, not the other way round. The Google satellite map and place search contact Google only when you open them.
Keyboard shortcuts
Press ? in the app for this table.
| Key | Action |
|---|---|
| V | Pan / select |
| D | Draw corners |
| A | Auto-detect a plot |
| R | Ruler |
| C | Cut the selected plot |
| F | Fit the whole map |
| L | Show / hide labels |
| Ctrl+Z / Ctrl+Y | Undo / redo |
| Esc | Back to Pan; finish or cancel a drawing |
| Enter | Finish the polygon |
| Delete | Remove the selected corner or the last cut point |
| Arrow keys | Nudge the selected corner (Shift: 10 px) |
| Space + drag | Pan in any tool |
| Wheel / pinch | Zoom |
| Double-click | Zoom in (Pan) or finish (Draw) |
| Right-click | Remove a corner, cut point or division line |
Accuracy and legal standing
What Naapi measures is the map. On a portal PDF whose lines are drawn (most of them), the outline is taken from the drawing itself and the figure is as good as the drawing and the scale — typically within a fraction of a percent of the rakba on the khatiyan when the scale is right. On a scan or a photograph the outline is traced through pixels, and the paper's stretch, the scan's distortion and the line's thickness all enter the figure; treat it as an estimate and check the scale with a plot of known area. Reasons a measured area differs from the recorded rakba are explained on How to read a mauza naksha.
Area from a raster scan is an estimate. Always verify the scale and boundary against an official survey record before legal use. A batwara drawn here is a planning estimate, not a legal partition. Satellite imagery is for finding and cross-checking, not for the record.
More short answers are on the FAQ.